Cat5e vs Cat6 RJ45 Cable

Ethernet cable has never stopped its development to cater for the ever increasing demand of higher performance data center. Cat5e and Cat6 RJ45 cables are two most commonly used Ethernet cables in current market. As their names implied, the difference between them are defined by the number and letter “5e” and “6”. What do these terms mean? Cat5e vs Cat6 RJ45 cable: What’s the difference? This article is dedicated to answering this question.
cabling of Cat5e vs Cat6 cable

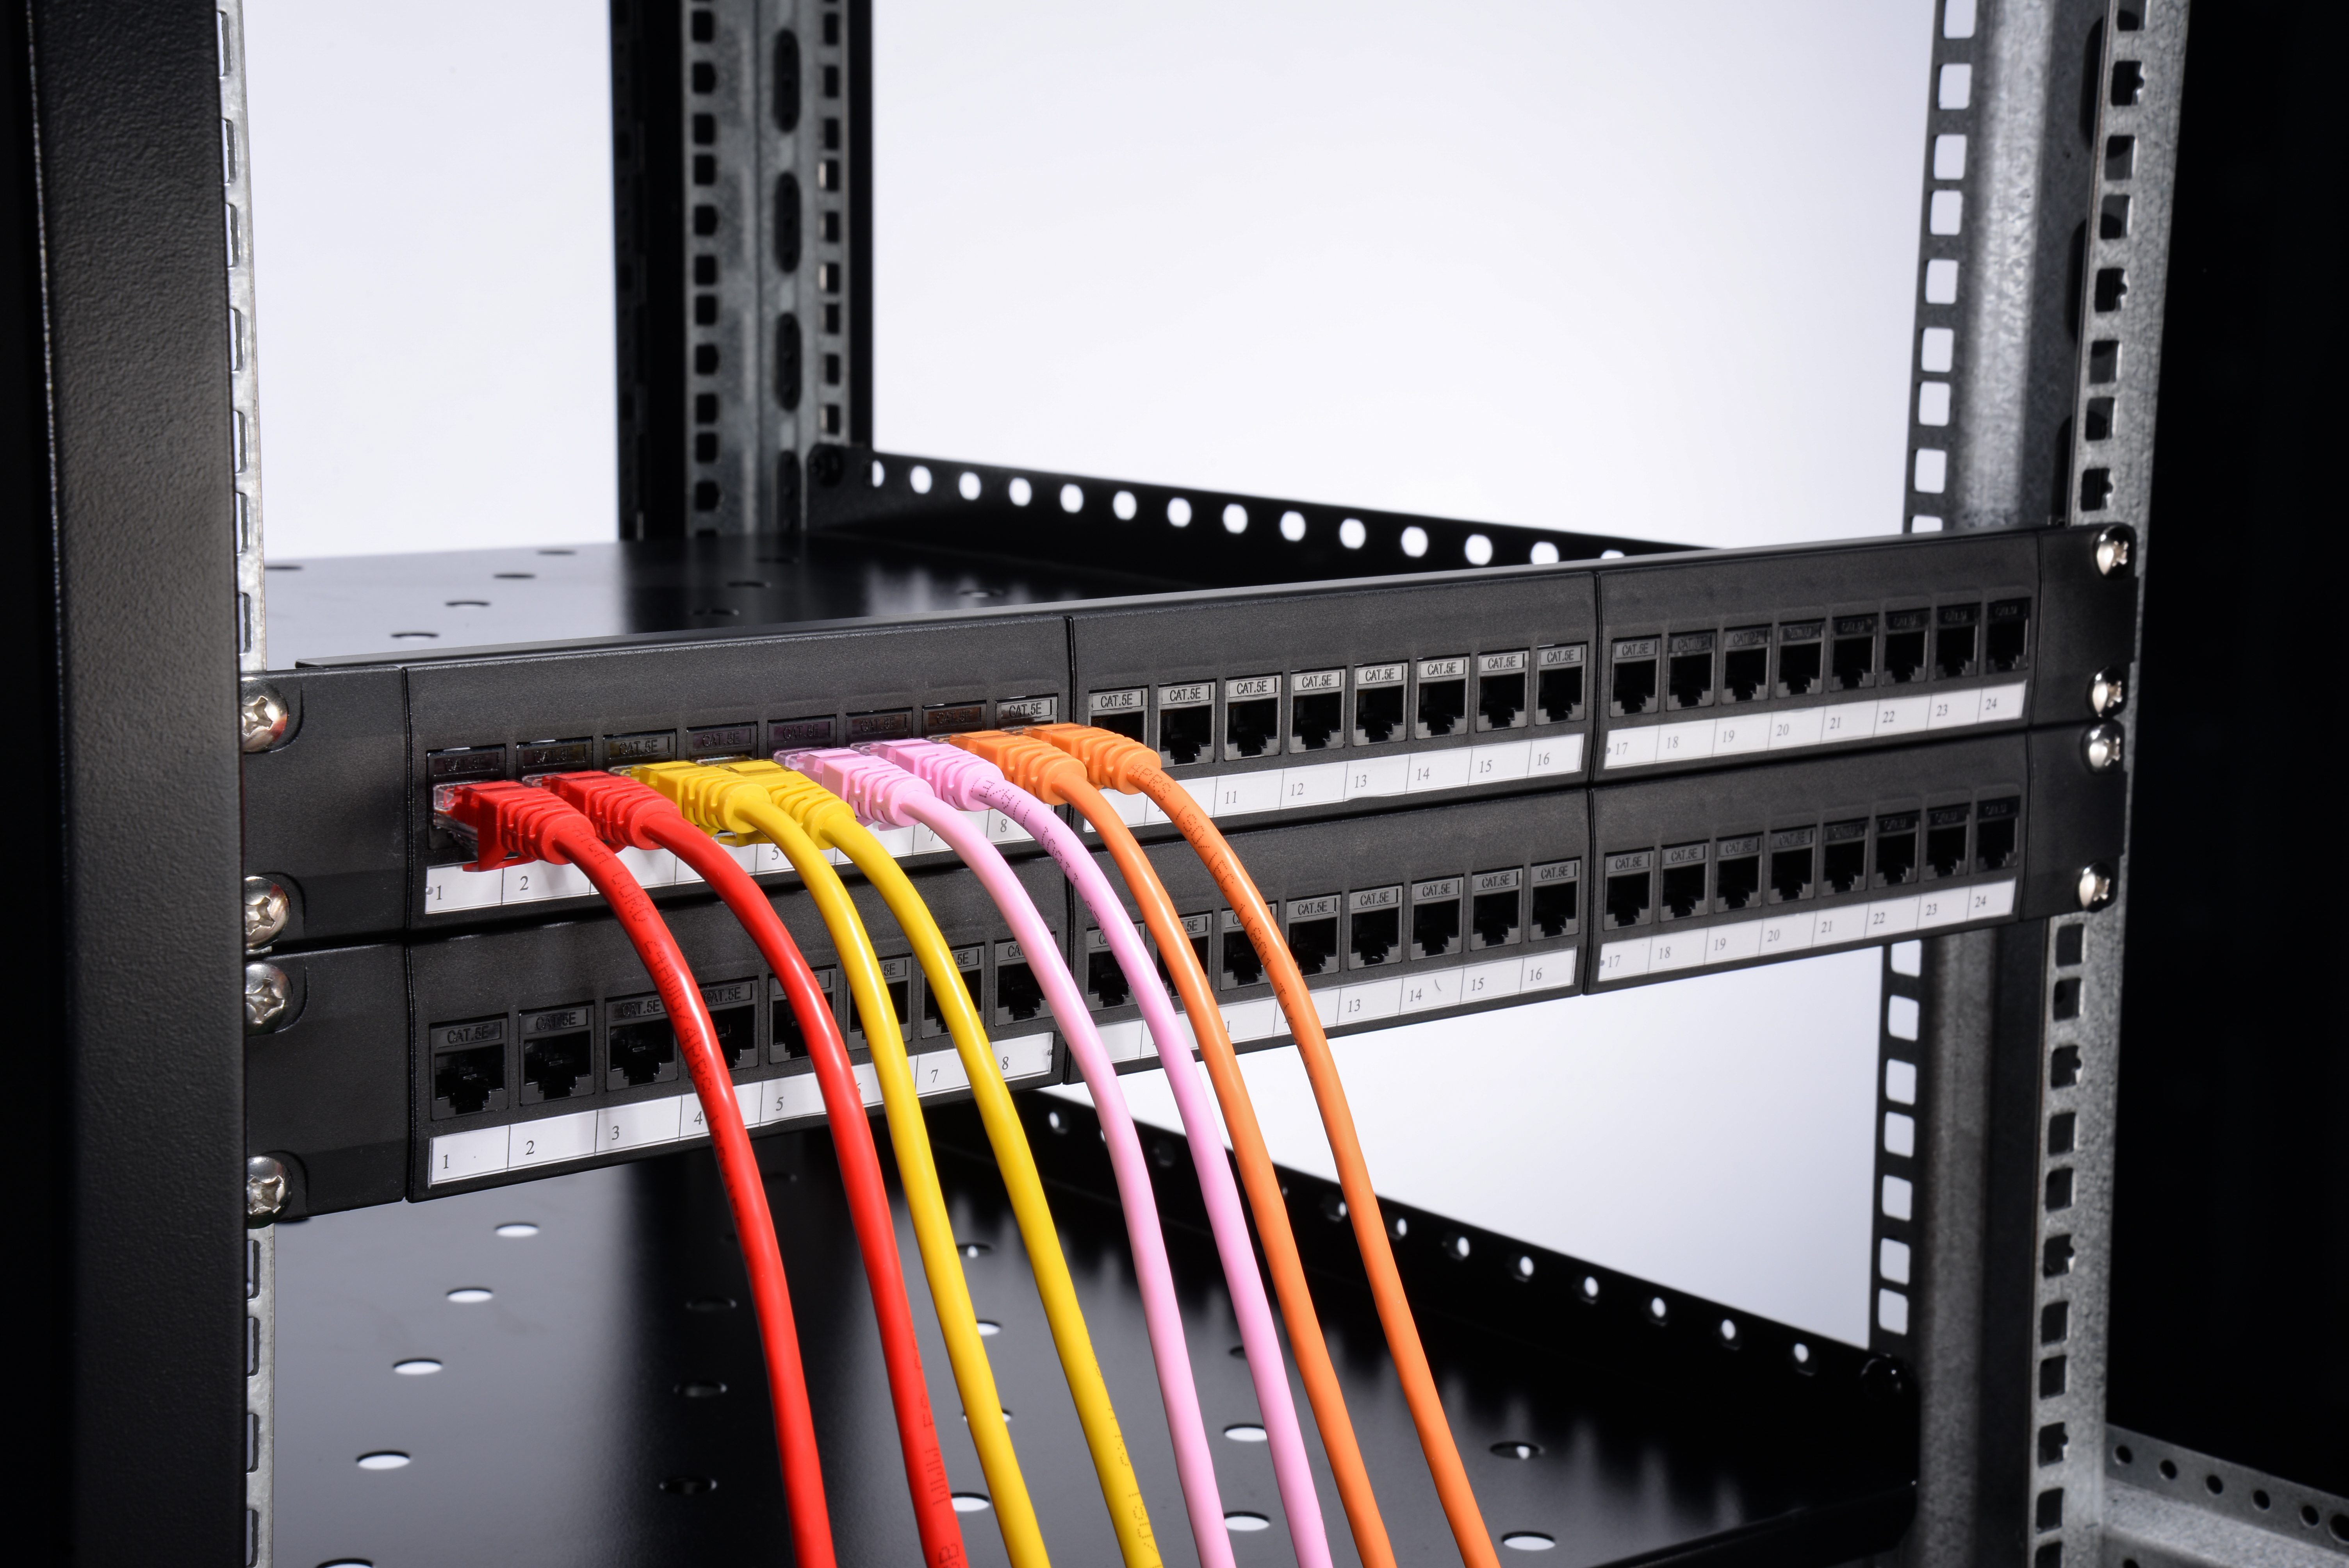
Figure 1: Cabling of Cat5e vs Cat6 RJ45 cable.

Cat5e vs Cat6: RJ45 Cable Overview

Cat5e and Cat6 are two different Ethernet cables classified by standard categories. The “Cat” refers to “Category of cable”, and the terms “5e” and “6” refer to different standard of category.

What Is Cat5e Cable?

Cat5e cable (Category 5e cable) is an enhanced version of Cat5. While inheriting the construction and 100MHz bandwidth of its predecessor, Cat5e improves performance by introducing optimized specifications in data rate and crosstalk defense. It transfers data at 10 times the speed of Cat5 cable, up to 1000Mbps. It supports Gigabit Ethernet and frequently used in home networking environment with various lengths and premise wiring.

Cat5e UTP Ethernet patch cable

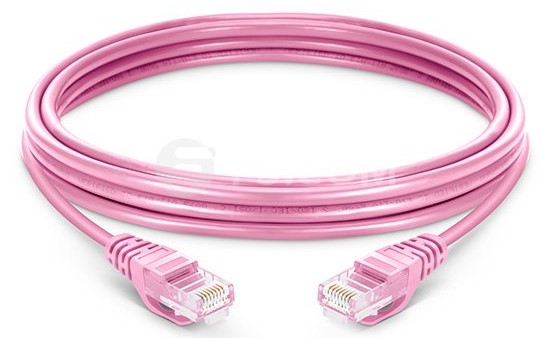
Figure 2: This photo shows a Cat5e UTP Ethernet patch cable.

What Is Cat6 Cable?

Cat6 cable (Category 6 cable) is a standard twisted-pair cable for Ethernet and other network layers. It has a 250MHz bandwidth and can rate up to 10Gbps in a limited distance of 55 meters. It can also reach to 100 meters (328 feet) at a slow rate of 1000Mbps. For its high speed, Cat6 cable is widely used to handle 10GbE. Moreover, Cat6 has excellent capability to reduce crosstalk due to improved shielding and twisted-pair cable design.

Cat6 UTP Ethernet patch cable

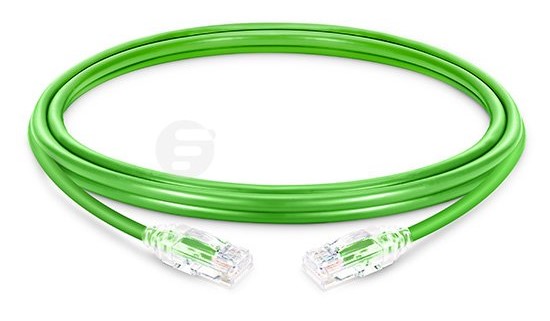
Figure 3: This photo shows a Cat6 UTP Ethernet patch cable.

Cat5e vs Cat6 RJ45 Cable: What’s the Difference?
Category Cat5e Cat6
Interface RJ45 RJ45
4 twisted-pair Wires Yes Yes
Bandwidth 100MHz 250MHz
Maximum Length 100 m 100m in slow network (≦1000Mbps);
55m in high network (10Gbps)
Data Rate 1Gbps 10Gbps over short distance (33-55m);
1Gbps within 100m
Crosstalk Far Less than Cat5; More than Cat6 Less crosstalk; high SNR
Cost cheaper 20% higher

As the table shown, although Cat5e and Cat6 RJ45 cable share commons in RJ45 connector and construction feature of twisted-pair copper wires, they are totally different standards of Ethernet cable. Cat5e RJ45 cable has lower level of transmission performance, while Cat6 RJ45 cable is optimized with a 250MHz bandwidth, higher data rate and stronger resistance to crosstalk and noise. The following passage will focus on the illustration of their functional differences.

·Crosstalk

Both Cat5e and Cat6 are comprising of 4 twisted-pair copper wires with a longitudinal separator to isolate them. This design can reduce electromagnetic interface among different wires. Compared with Cat5e, while providing equal level far end crosstalk (FEXT), return loss and insertion loss, Cat6 features lower near end crosstalk (NEXT). Simply put, Cat6 cable have high SNR (Signal Noise Ratio), which provide less noise, fewer errors and higher data rate in signal transmission.

·Date rate

Cat5e cable is limited at a 100MHz bandwidth, while Cat6 cable has a high bandwidth of 250MHz, which leads to different data rate. Cat5e can reach up to 1Gbps at a distance of 100 meters. The data rate of Cat6 varies based on its maximum length. Over long distance transmission within 100 meters, maximum data rate of Cat6 is 1000Mbps. In short length limited in 55 meters, it can support 10 Gigabit Ethernet. It is noted that in high crosstalk condition a transfer distance only within 33 meters is available.

Conclusion

This article made a comparison and contrast between Cat5e vs Cat6 RJ45 cable. While finding some similarities, it focus on their functional difference: crosstalk resistance ability and data rate. Cat6, as a descendant of Cat5, it owns higher standard of SNR and data rate, which gives it an edge in higher performance conditions required 10 Gigabit Ethernet.

Time-to-Link Test for 1000BASE-T and 10GBASE-T

Background

This post is composed on the basis of the physical layer (PHY) behavior assessment of 1000BASE-T and 10GBASE-T. In order to understand the test results and the meaning of this discussion, some terminologies have to be introduced first.

The Meaning of Time-to-Link

Time-to-link (TTL) is a system performance standard that characterizes and measures the PHY behavior through autonegotiation (AN) and 1G/10GBASE-T startup sequences (correspond to training). It is one of the two primary performance measures (the other is bit error rate) used to characterize BASE-T PHY link rate interoperability.

For Ethernet over twisted pair, autonegotiation is defined in clause 28 of IEEE 802.3. It is a procedure by which two connected devices choose common transmission parameters. In this process, the link partner firstly share their capabilities, such as speed, duplex mode, and flow control, and then choose the highest performance transmission mode they both support.

Since servers networking drivers must meet the third party certifications, the TTL standard used to measure link interoperability becomes rather important. Otherwise, long TTLs (>6s) can lead to device certification failures.

How to Measure the Link Interoperability?

There are several representative link interoperability metrics associated with TTL. Their meanings are explained as follows:

TTL: time to achieve link after link initiate event.

Link attempts number: number of attempts made to resolve Master/Slave status for each link. Within a link, one link partner is designated as the master timing source for transmitted signals in both directions. One partner is Master and one partner is Slave.

Link drops number: number of link drops observed after link is established.

Clock recovery: Some digital data streams, especially high-speed serial data streams, such as Ethernet, are sent without an accompanying clock signal. The receiver generates a clock from an approximate frequency reference, and then phase-aligns the clock to the transitions in the data stream with a phase-locked loop (PLL). This is one method of performing a process commonly known as clock and data recovery (CDR). Here it is also called Master/Slave resolution.

TTL distribution: percentage of links by link time.

Speed downshift/downgrade: resolved speed if other than 10Gbps.

Presentation and Analysis of the Results

Totally 1550 link tests are performed, and the results are:

  • 1,050 out of 1,550 tests, or 67% of the total number of link tests, achieved a link state in 7s or less (green slice).
  • 499 out of 1,550 tests, or 32% of the total number of link tests, achieved a link state somewhere between 7s and 15s (blue slice).
  • 1 out of 1,550 tests, or < 1 % (actually 0.15%) of the total number of link tests, achieved a link state longer than 15s (exactly 16.4s; yellow splice, actually it should be smaller than presented in the pie chart).

TTL % of total trials pie chart

Source: http://www.ieee802.org

Characterizing TTL behavior

Cumulative percentage (%) TTL is the distribution of measured link times as a percentage of total measured link time. Total link time recorded for all 1,550 tests is 10,837,835ms or about 3h 0min 38sec. The measured link time and cumulative percentage of each result is recorded in following table and chart:

Cumulative percentage TTL

Source: http://www.ieee802.org

TTL behavior

Source: http://www.ieee802.org

TTL Distribution and Master/Salve Resolution by Channel Length

In this part, the example of 10GBASE-T TTL measured from 2m to 115m channels (9790 links) will be given. The average TTL across 2m to 100m is 7.5s; the average time in autonegotiation is 5s; the average time in training is 2.6s. The following two charts illustrate the TTL distribution and clock recovery results by channel lengths from 2m to 115m.

TTL distribution by channel length

Source: http://www.ieee802.org

clock recovery distribution by channel length

Source: http://www.ieee802.org

According to the charts, we can see that there is an apparent loop timing trend towards Master preference with increasing channel length. And very long TTLs (>15s) at >100m channels are associated with downshits to 1Gb link speed.

AN & Training Times for 1000BASE-T and 10GBASE-T

Measured autonegotiation and training times from 1550 1Gb links for 10GBASE-T device to 1000BASE-T link partner, and 10GBASE-T device to 10GBASE-T link partner are respectively:

AN & traning times and TLL

Conclusion

From the test results on 1000BASE-T and 10GBASE-T, user TTL experience of 1000BASE-T installed over Cat5e cable or better is between 3s and 4s, and 10GBASE-T installed over Cat6a or better is about 7s, or longer in some cases. And the measured autonegotiation times for 1000BASE-T and 10GBASE-T are comparable. And for future 2.5/5GBASE-T, it is highly desirable that their autonegotiation and startup times can be improved, and that total TTL be minimized, so as to be more aligned with end-users’ expectations and requirements.

Appendix: AN & Training Times for 1000BASE-T and 10GBASE-T

1G AN time ditribution

1G traning time ditribution

10G AN time ditribution

10G traning time ditribution

Source: http://www.ieee802.org