
This post is composed on the basis of the physical layer (PHY) behavior assessment of 1000BASE-T and 10GBASE-T. In order to understand the test results and the meaning of this discussion, some terminologies have to be introduced first.
Time-to-link (TTL) is a system performance standard that characterizes and measures the PHY behavior through autonegotiation (AN) and 1G/10GBASE-T startup sequences (correspond to training). It is one of the two primary performance measures (the other is bit error rate) used to characterize BASE-T PHY link rate interoperability.
For Ethernet over twisted pair, autonegotiation is defined in clause 28 of IEEE 802.3. It is a procedure by which two connected devices choose common transmission parameters. In this process, the link partner firstly share their capabilities, such as speed, duplex mode, and flow control, and then choose the highest performance transmission mode they both support.
Since servers networking drivers must meet the third party certifications, the TTL standard used to measure link interoperability becomes rather important. Otherwise, long TTLs (>6s) can lead to device certification failures.
There are several representative link interoperability metrics associated with TTL. Their meanings are explained as follows:
TTL: time to achieve link after link initiate event.
Link attempts number: number of attempts made to resolve Master/Slave status for each link. Within a link, one link partner is designated as the master timing source for transmitted signals in both directions. One partner is Master and one partner is Slave.
Link drops number: number of link drops observed after link is established.
Clock recovery: Some digital data streams, especially high-speed serial data streams, such as Ethernet, are sent without an accompanying clock signal. The receiver generates a clock from an approximate frequency reference, and then phase-aligns the clock to the transitions in the data stream with a phase-locked loop (PLL). This is one method of performing a process commonly known as clock and data recovery (CDR). Here it is also called Master/Slave resolution.
TTL distribution: percentage of links by link time.
Speed downshift/downgrade: resolved speed if other than 10Gbps.
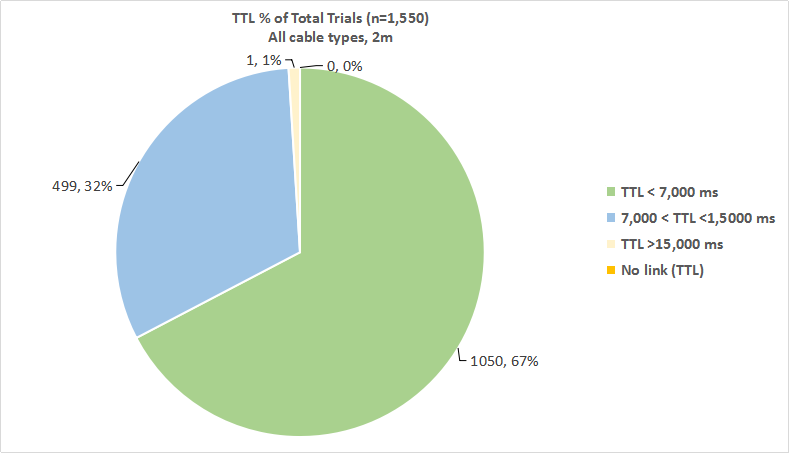
Totally 1550 link tests are performed, and the results are:
- 1,050 out of 1,550 tests, or 67% of the total number of link tests, achieved a link state in 7s or less (green slice).
- 499 out of 1,550 tests, or 32% of the total number of link tests, achieved a link state somewhere between 7s and 15s (blue slice).
- 1 out of 1,550 tests, or < 1 % (actually 0.15%) of the total number of link tests, achieved a link state longer than 15s (exactly 16.4s; yellow splice, actually it should be smaller than presented in the pie chart).
Source: http://www.ieee802.org
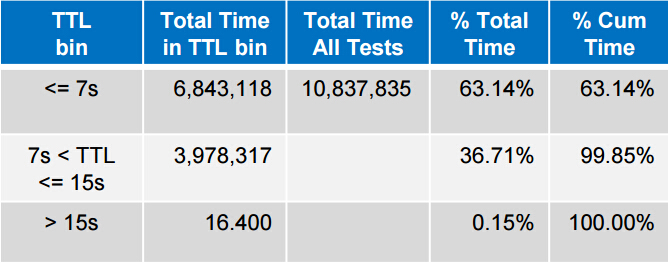
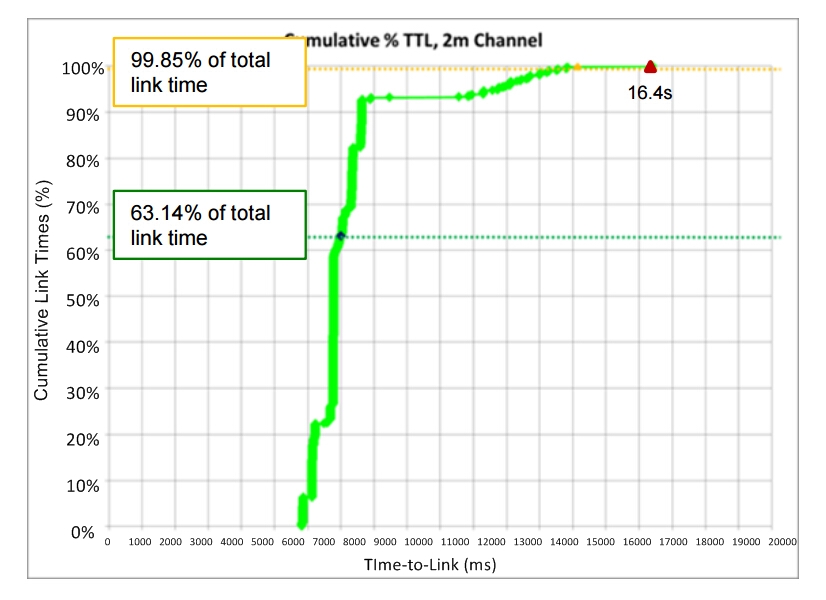
Cumulative percentage (%) TTL is the distribution of measured link times as a percentage of total measured link time. Total link time recorded for all 1,550 tests is 10,837,835ms or about 3h 0min 38sec. The measured link time and cumulative percentage of each result is recorded in following table and chart:
Source: http://www.ieee802.org
Source: http://www.ieee802.org
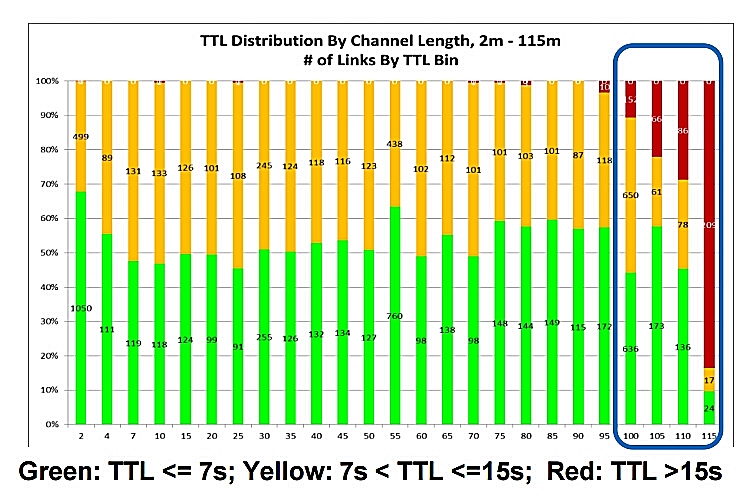
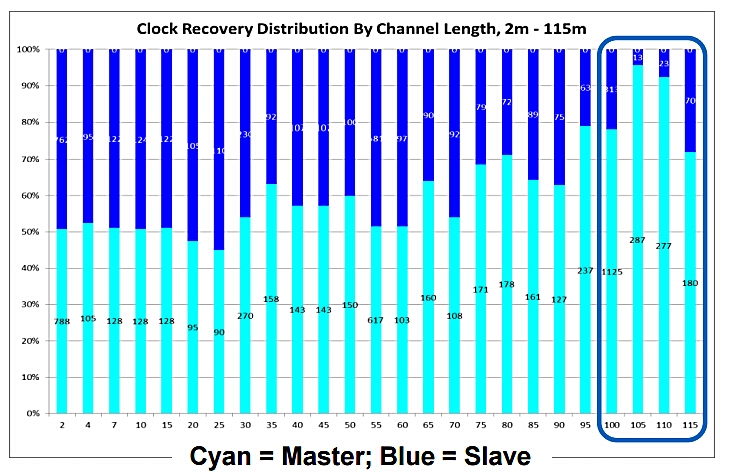
In this part, the example of 10GBASE-T TTL measured from 2m to 115m channels (9790 links) will be given. The average TTL across 2m to 100m is 7.5s; the average time in autonegotiation is 5s; the average time in training is 2.6s. The following two charts illustrate the TTL distribution and clock recovery results by channel lengths from 2m to 115m.
Source: http://www.ieee802.org
Source: http://www.ieee802.org
According to the charts, we can see that there is an apparent loop timing trend towards Master preference with increasing channel length. And very long TTLs (>15s) at >100m channels are associated with downshits to 1Gb link speed.
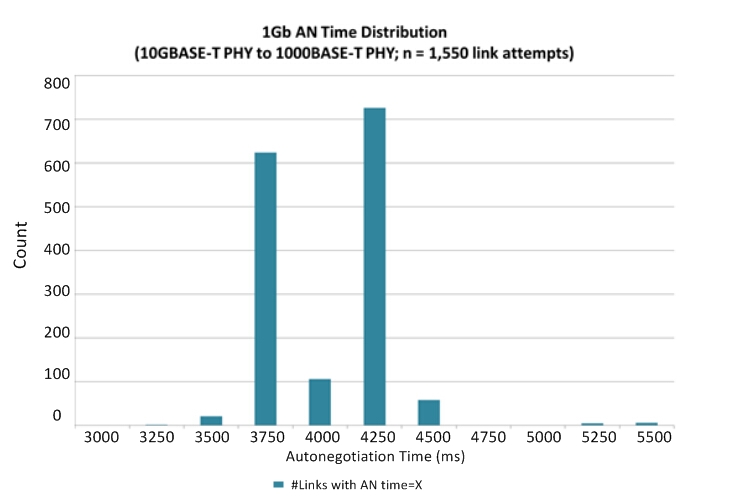
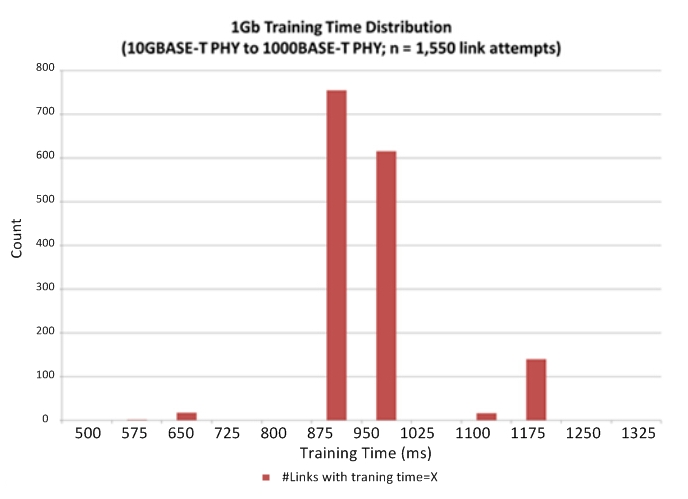
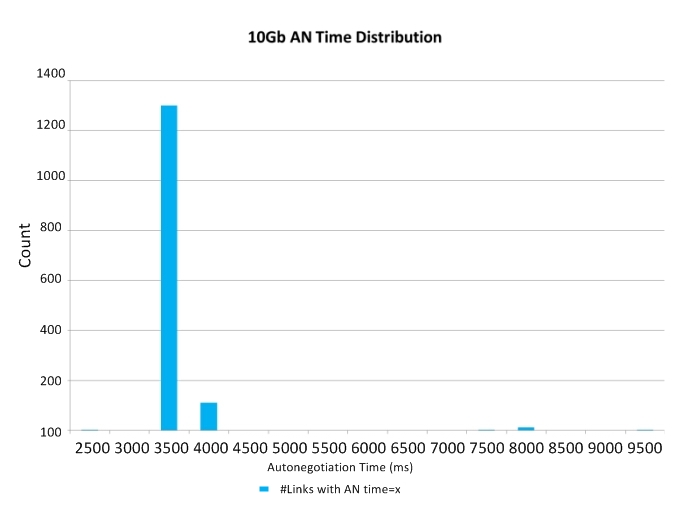
Measured autonegotiation and training times from 1550 1Gb links for 10GBASE-T device to 1000BASE-T link partner, and 10GBASE-T device to 10GBASE-T link partner are respectively:
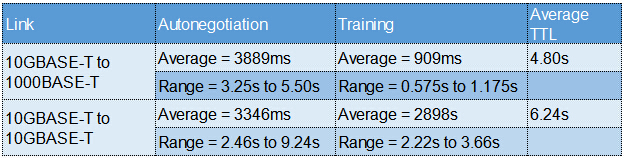
From the test results on 1000BASE-T and 10GBASE-T, user TTL experience of 1000BASE-T installed over Cat5e cable or better is between 3s and 4s, and 10GBASE-T installed over Cat6a or better is about 7s, or longer in some cases. And the measured autonegotiation times for 1000BASE-T and 10GBASE-T are comparable. And for future 2.5/5GBASE-T, it is highly desirable that their autonegotiation and startup times can be improved, and that total TTL be minimized, so as to be more aligned with end-users’ expectations and requirements.
Appendix: AN & Training Times for 1000BASE-T and 10GBASE-T

Source: http://www.ieee802.org